Arctic sea ice near record lows
Arctic sea ice extent averaged for August 2011 reached the second lowest level for the month in the 1979 to 2011 satellite record. Both the Northwest Passage and the Northern Sea route appear to be open. Throughout August, sea ice extent tracked near the record lows of 2007, underscoring the continued decline in Arctic ice cover.
Note: Arctic sea ice extent will likely reach its minimum extent for the year sometime in the next two weeks. NSIDC will make a preliminary announcement when ice extent has stopped declining and has increased for several days in a row. Monthly data for September will be released in early October.
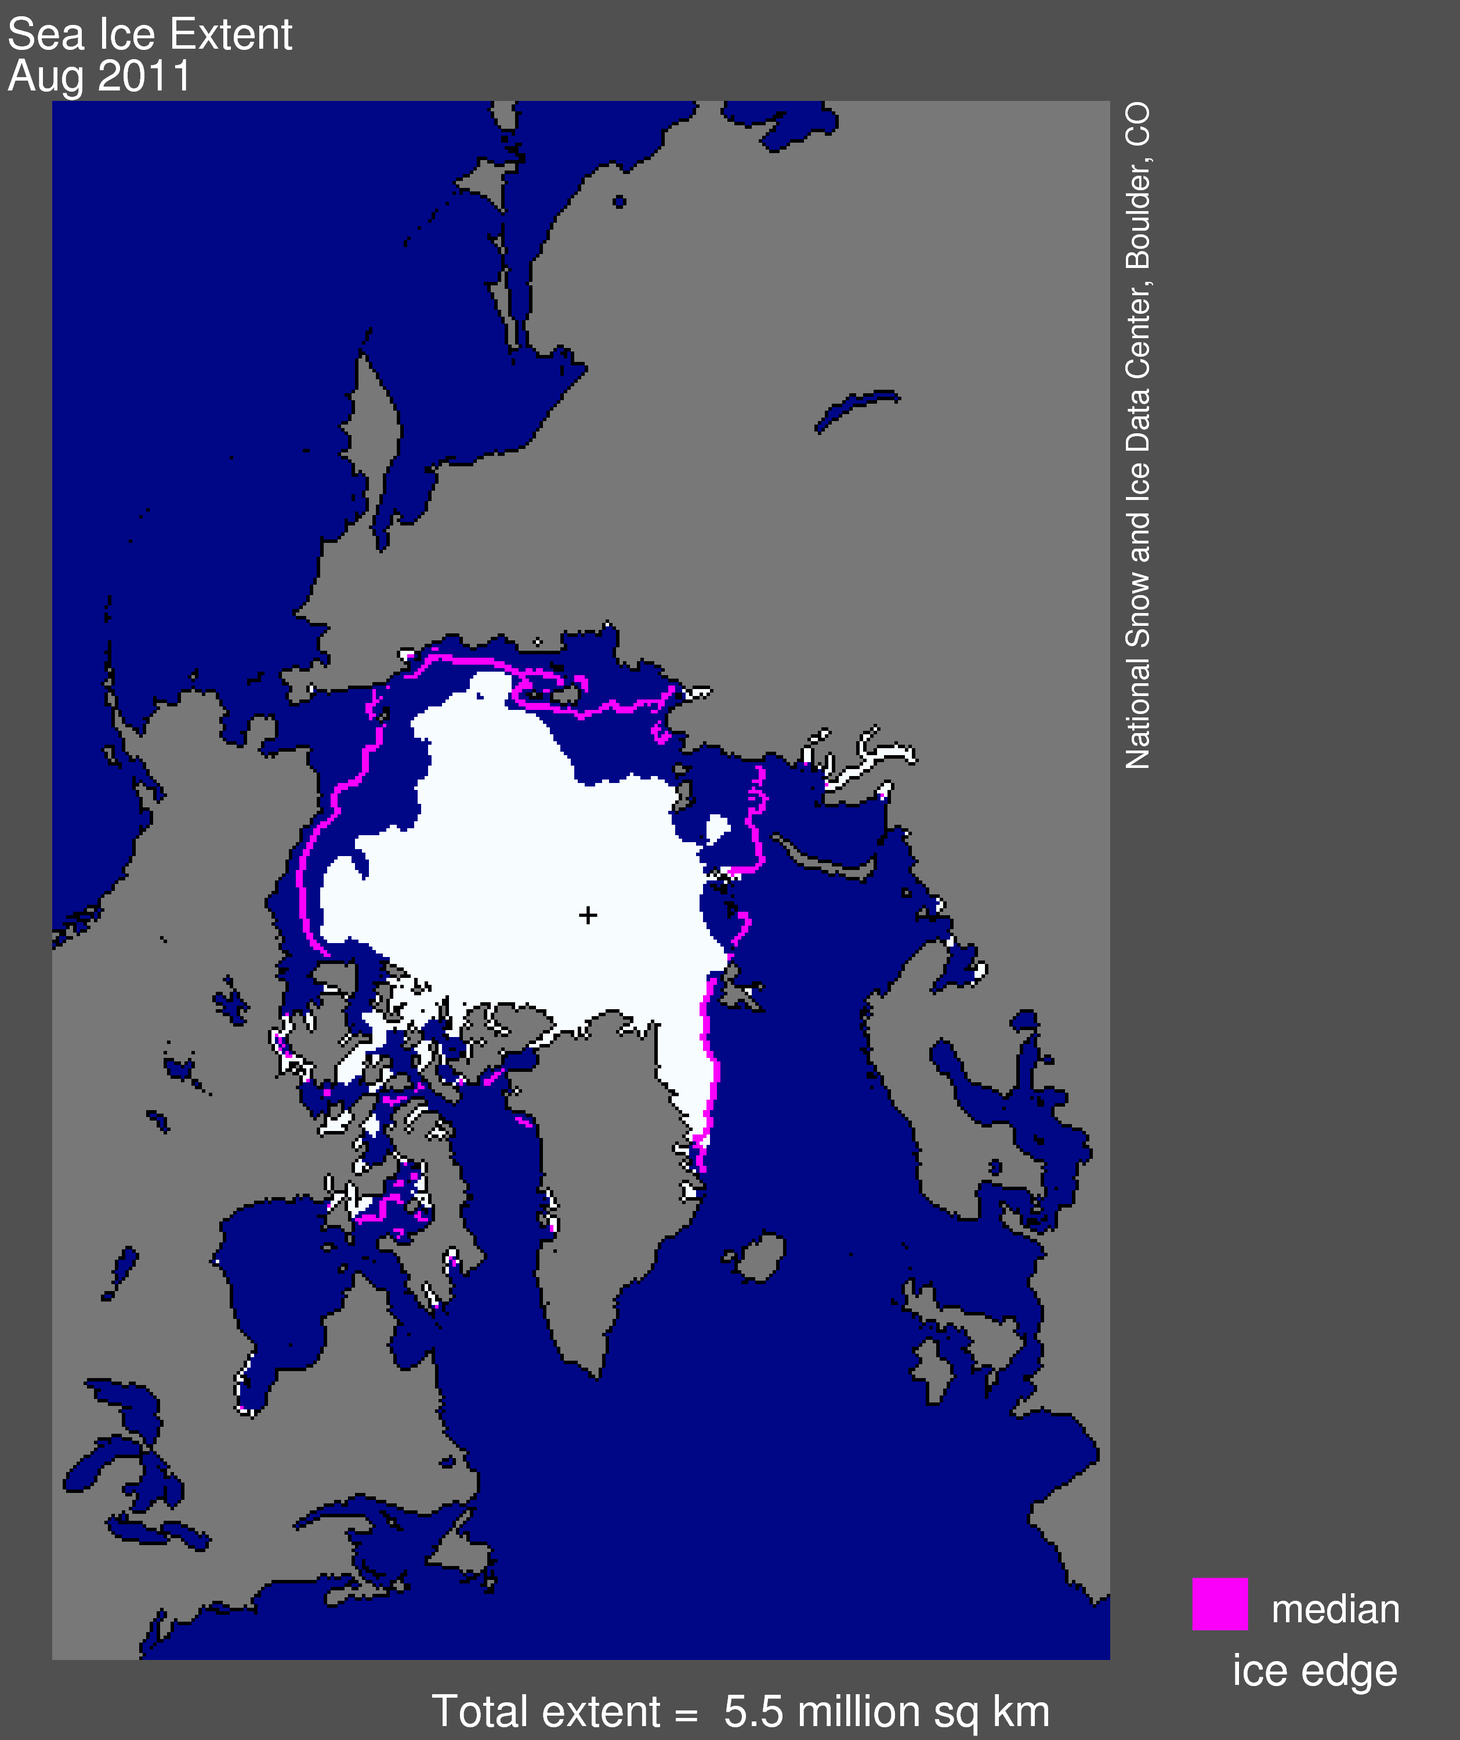
Figure 1. Arctic sea ice extent for August 2011 was 5.52 million square kilometers (2.13 million square miles). The magenta line shows the 1979 to 2000 median extent for that month. The black cross indicates the geographic North Pole. Sea Ice Index data. About the data. —Credit: National Snow and Ice Data Center. High-resolution image
Overview of conditions
Average ice extent for August 2011 was 5.52 million square kilometers (2.13 million square miles). This is 160,000 square kilometers (61,800 square miles) above the previous record low for the month, set in August 2007, and 2.15 million square kilometers (830,000 square miles), or 28% below the average for 1979 to 2000. Sea ice coverage remained below normal everywhere except the East Greenland Sea. In addition, several large areas of open water (polynyas) have opened within the ice pack.
On August 31, 2011, Arctic sea ice extent was 4.63 million square kilometers (1.79 million square miles). This is 100,000 square kilometers (38,600 square miles) higher than the previous record low for the same day of the year, set in 2007. As of September 5, ice extent had fallen below the minimum ice extents in September 2010 and 2008 (previously the third- and second-lowest minima in the satellite record). If ice stopped declining in extent today it would be the second-lowest minimum extent in the satellite record.
Higher-resolution Advanced Microwave Scanning Radiometer-Earth Observing System (AMSR-E) data processed by the University of Bremen showed ice extent on September 5 as falling below the same date in 2007.
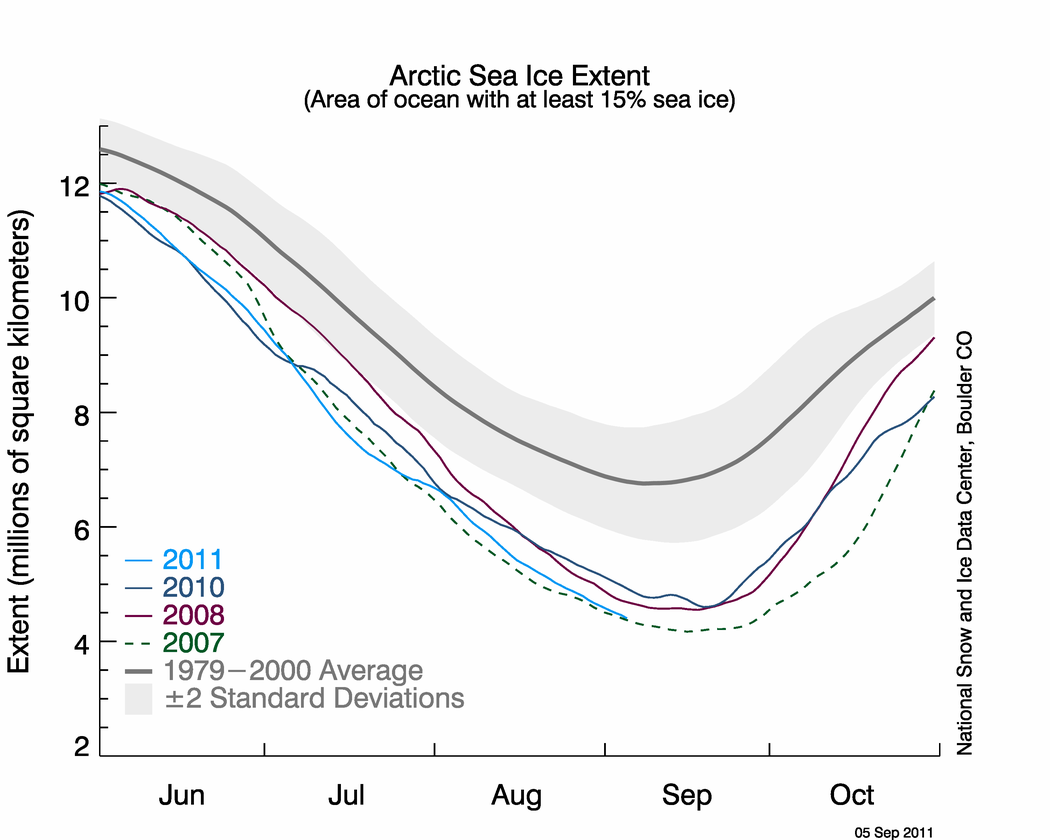
Figure 2. The graph above shows daily Arctic sea ice extent as of September 5, 2011, along with daily ice extents for previous low-ice-extent years. Light blue indicates 2011, dashed green shows 2007, dark blue shows 2010, purple shows 2008, and dark gray shows the 1979 to 2000 average. The gray area around the average line shows the two standard deviation range of the data. Sea Ice Index data. —Credit: National Snow and Ice Data Center. High-resolution image
In August, sunlight wanes in the Arctic and the sea ice decline starts to slow down. Although the decline slowed somewhat during August, ice extent retreated at a faster pace than average, at a pace of 67,700 square kilometers (26,100 square miles) per day. In comparison, the average rate of decline for August 1979 to 2000 was 53,700 square kilometers (20,700 square miles) per day.
Air temperatures were 1 to 4 °C (2 to 7 °F) higher than average (relative to the 1981 to 2010 climatology) over the Arctic Ocean (measured approximately 1,000 meters above the surface). The strongest anomalies were over the Northwest Passage region. High pressure persisted over much of the central Arctic Ocean, associated with a wind pattern that helped to push ice from the Beaufort Sea westward into the Chukchi Sea. This may have slowed some ice loss in the Chukchi Sea region. However, the wind pattern also transported ice into open waters warmed during the summer, fostering melt.
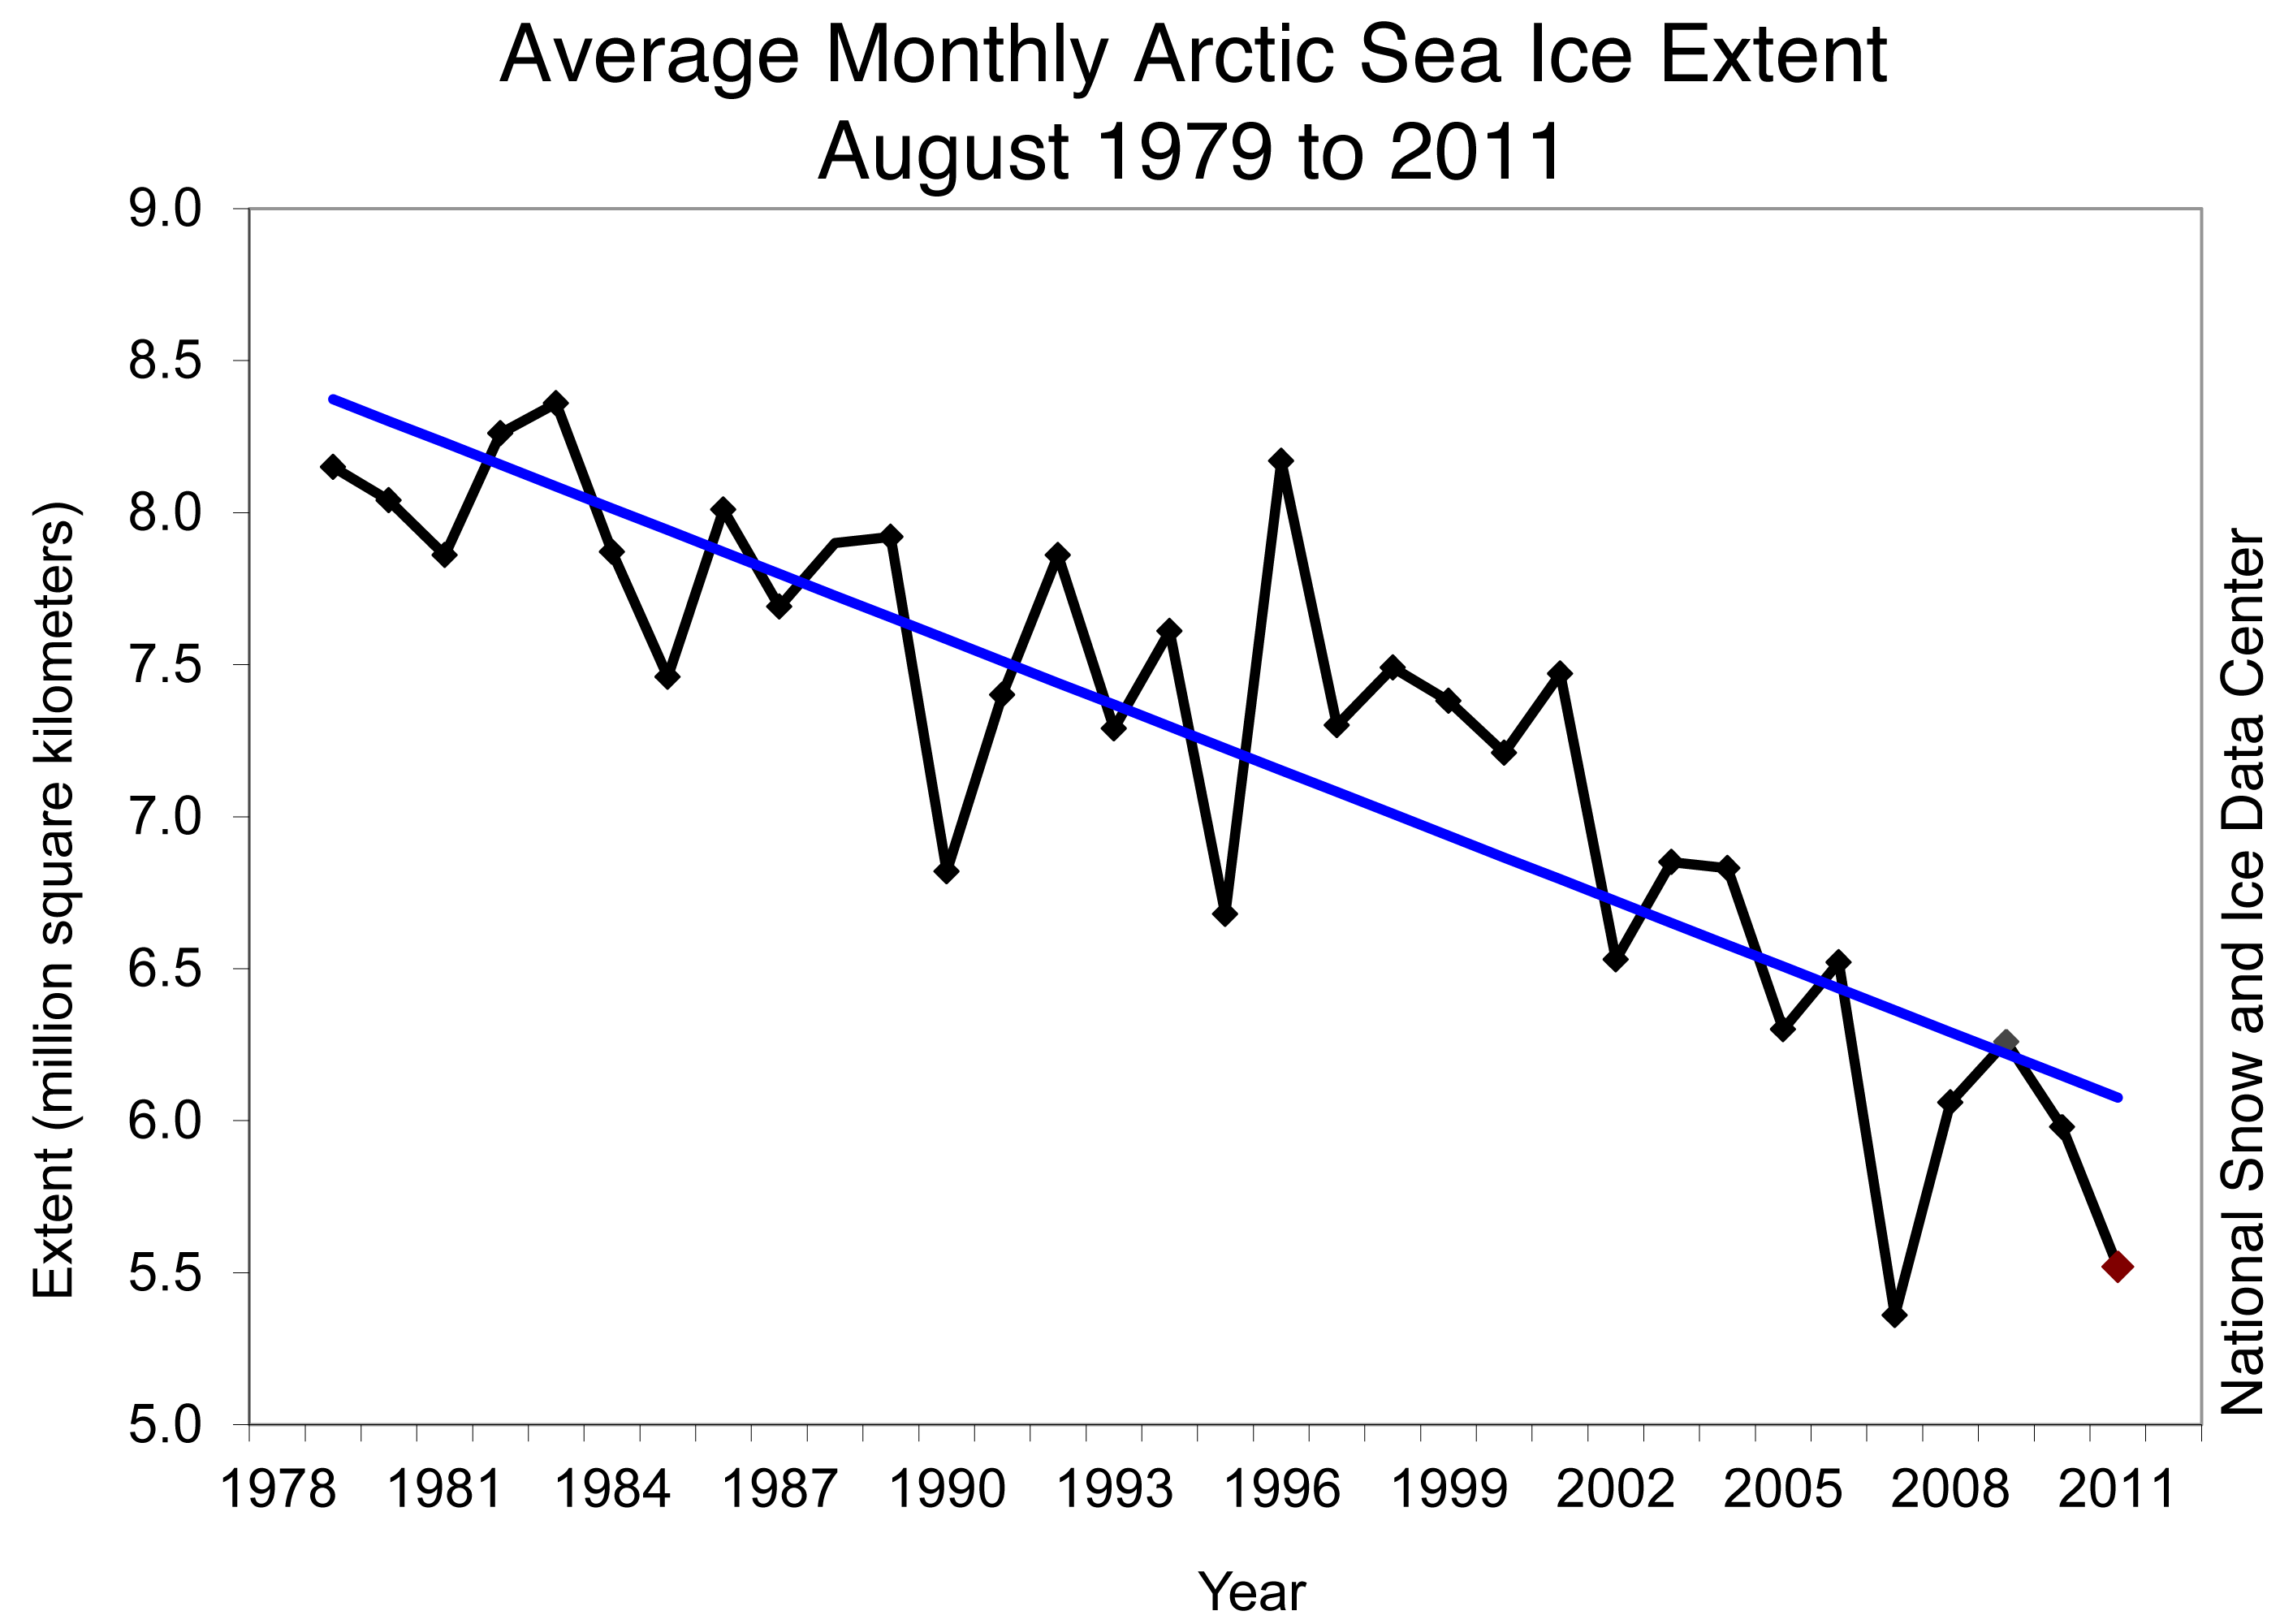
Figure 3. Monthly August ice extent for 1979 to 2011 shows a decline of 9.3% per decade. —Credit: NSIDC. High-resolution image
August 2011 compared to previous years
Average Arctic sea ice extent for August 2011 was the second-lowest for August in the satellite data record. Including 2011 the linear trend for August now stands at –9.3% per decade.
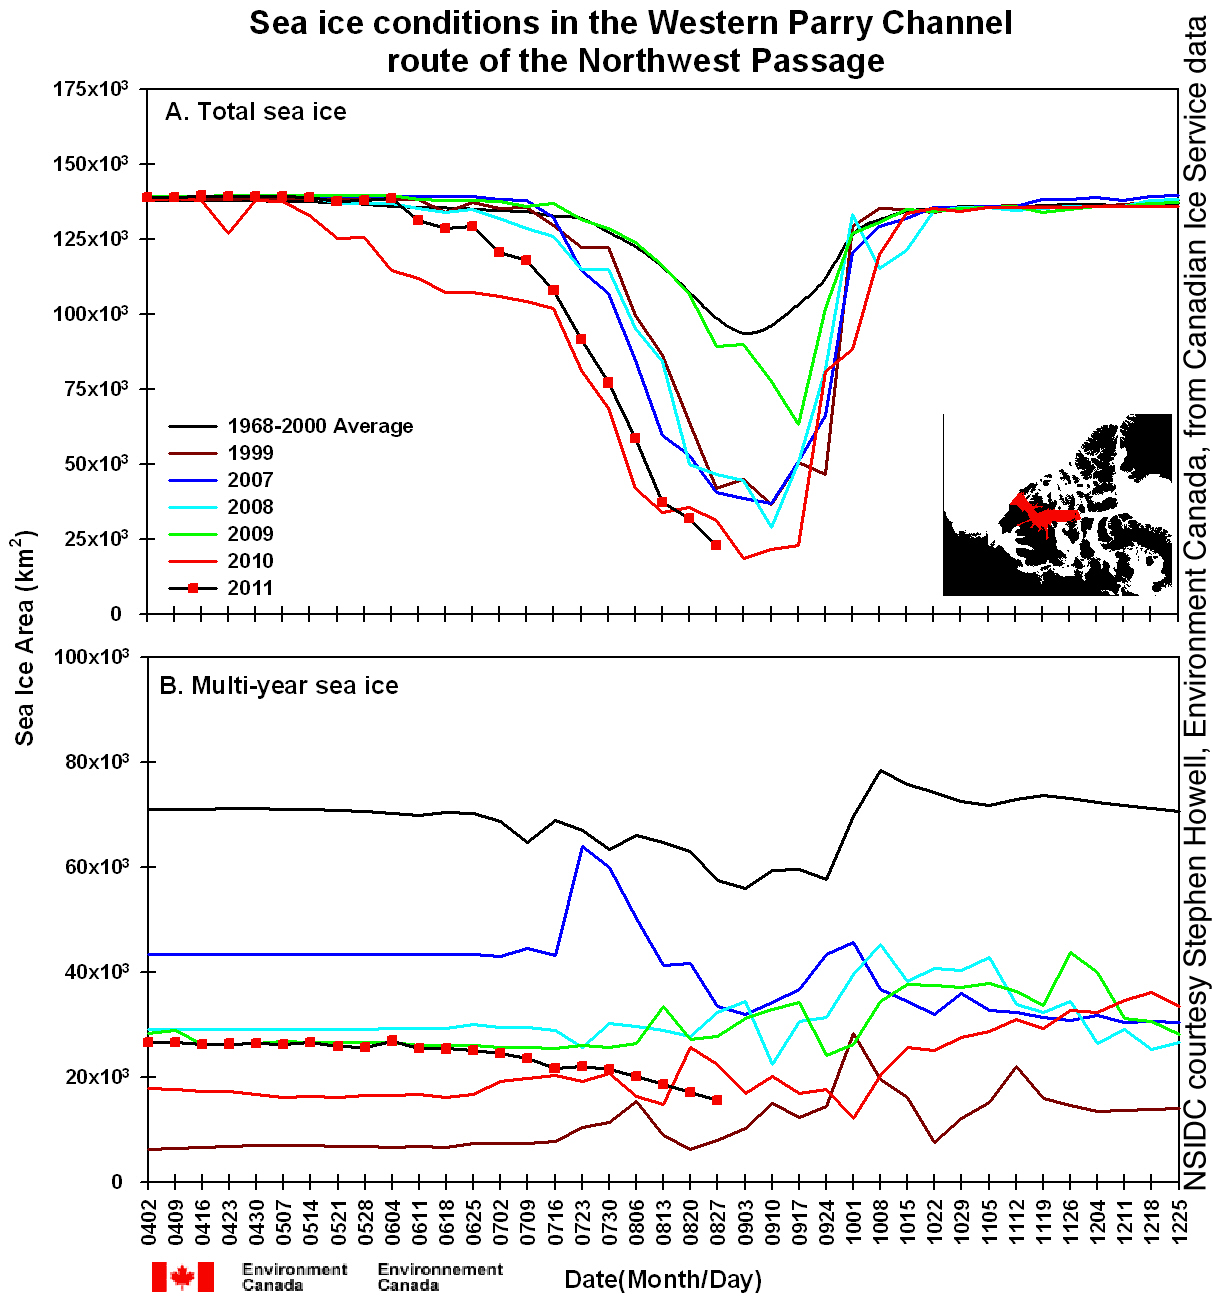
Figure 4. This time series shows total sea ice area (top) and multi-year ice area (bottom) for selected years within the Western Parry Channel route of the Northwest Passage. The black line with red dots shows 2011, and other colors show ice conditions in different years.—Credit: NSIDC courtesy Stephen Howell, Environment Canada, from Canadian Ice Service data.
Northwest Passage sea ice at record low levels
Sea ice is now almost completely gone from the channels of the Northwest Passage, with the exception of a small strip of ice across a stretch of the Parry Channel. The southern route (Amunden's Route) is ice free. According to the Canadian Ice Service, sea ice extent in the western Parry Channel is now the lowest at this time of year since record keeping began in 1966 and very little multi-year ice remains. According to Multisensor Analyzed Sea Ice Extent (MASIE) data, ice cover across the Canadian Archipelago is at record low levels.
The Northern Sea Route along Siberia remains ice-free, with a number of cargo ships passing through in recent weeks. However, some areas of older, thicker ice have helped preserve the tongue of ice extending into the East Siberian Sea.
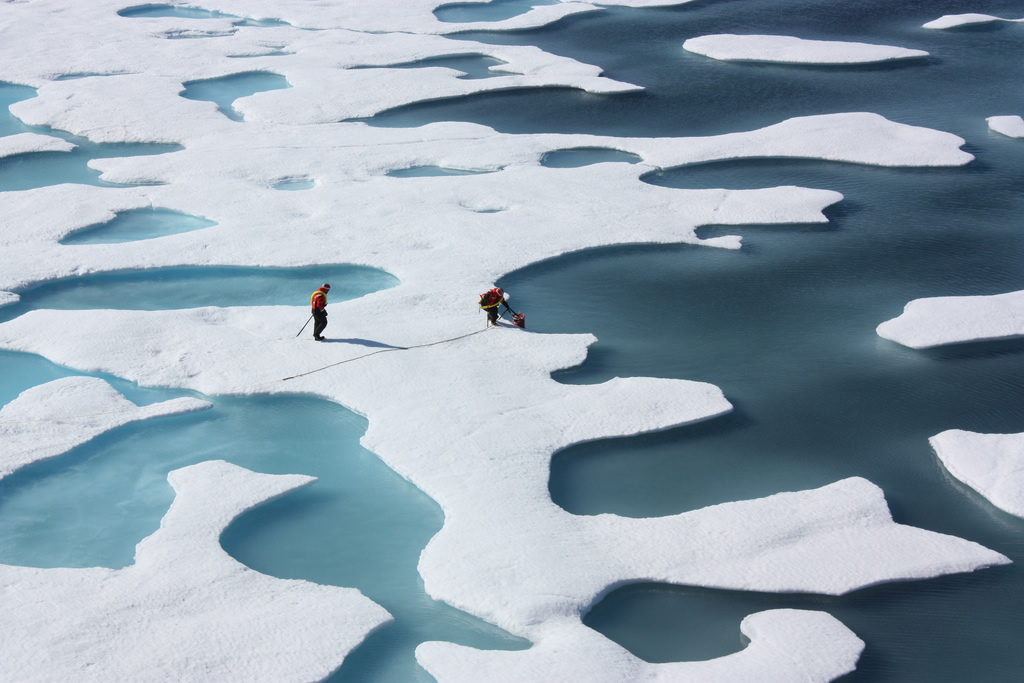
Figure 5. This photograph from the NASA ICESCAPE mission in July shows melt ponds on the surface of the Arctic sea ice cover. Surface melt has now stopped as air temperatures have cooled. But relatively warm water will continue to melt the ice from below for another couple of weeks. —Credit: NASA/Kathryn Hansen. High-resolution image
Will Arctic sea ice extent reach a new record in 2011?
The melt season for Arctic sea ice will soon draw to a close. Surface melt has already largely ended and the ocean waters are cooling. Air temperatures at the North Pole have fallen below freezing. However, with the ice cover now thinner than in years past, there is a greater potential for late-season ice loss, caused by warm water melting ice from below or winds that push the ice together.
Whether Arctic sea ice breaks a new record hinges on three factors: First, how much heat is left in the ocean to eat away at the ice edge and bottom? Second, will wind patterns blow the ice together and reduce ice extent or will they disperse the ice and expand ice extent? Finally, just how thin is the remaining ice cover? Thin ice quickly melts away when it is surrounded by warm water.
http://nsidc.org/arcticseaicenews/


No comments:
Post a Comment